

Lorena D’Anunciação Silva1; Lorena Ventura Brandão2; Priscilla Benfica Cirilio3; Geraldo de Barros Ribeiro4
DOI: 10.17545/eoftalmo/2018.0009
ABSTRACT
OBJECTIVE: To verify the capacity of a new test in identifying individuals with and without dyschromatopsia and to measure their disturbance, based on Ishi-hara’s standard test.
METHODS: Fifteen computer-generated images for the di-agnosis of dyschromatopsia were used to create a new test. These images proved to be helpful in the diagnosis of dyschromatopsia, and they were used as the basis for an additional 120 images of numbers that were created with increasing gradients of −10% to +40% green hue in each of the numbers. These images were distributed across 15 pages, printed and presented to the participants, wich should identify the number displayed on each of the images.
RESULTS: A total of 223 individuals were evaluated, 130 of whom were females and 93 of whom were males. Five male subjects were diagnosed with dyschro-matopsia, with errors in the identification of an average of 62.6% of the 135 images presented. The other male subjects had a mean error rate of 5.04%. The variation in green hue intensity in the numbers presented in the images did not allow for the measurement of the degree of dyschromatopsia.
CONCLUSION: The percentage of individuals diagnosed with dyschromatopsia was lower than expected. It was not possible to determine the degree of dyschromatopsia us-ing the test created herein. However, with the software developed, we can cre-ate new tests to diagnose and try to determine the degree of dyschromatopsia.
Keywords: Achromatopsia; Color Vision Defects; Deutan Defect; Color Perception Tests.
RESUMO
OBJETIVO: Verificar a capacidade de um novo teste em identificar indivíduos portadores ou não de discromatopsia e graduar seu distúrbio, tendo como base de comparação o teste padrão de Ishihara.
MÉTODOS: Quinze imagens criadas para o diagnóstico de discromatopsia foram utilizadas no desenvolvimento do novo teste. A partir dessas, eficazes no diagnóstico de discromatopsia, foram criadas120 imagens numéricas com graduações crescentes de -10% a +40% da cor verde em cada um dos números. Essas imagens foram distribuídas em 15 páginas, impressas e apresentadas aos indivíduos testados, que deveriam identificar o número visualizado em cada uma das imagens.
RESULTADOS: Avaliou-se 223 indivíduos, sendo 130 do sexo feminino e 93 do sexo masculino. Cinco indivíduos do sexo masculino foram diagnosticados com discromatopsia, com 62,6% de erros de identificação das 135 imagens apresentadas, enquanto os demais apresentaram, em média, 5,04% de erros. A variação na graduação da cor verde nos números das imagens apresentadas não permitiu mensurar o grau de discromatopsia.
CONCLUSÃO: A porcentagem de indivíduos diagnosticados com discromatopsia foi menor que o esperado. Não foi possível graduar a discromatopsia com o teste criado, porém, com o software desenvolvido, será possível criar novos testes para diagnosticar e graduar a discromatopsia.
Palavras-chave: Acromatopsia; Defeitos da visão cromática; Daltonismo; Testes de percepção de cores.
RESUMEN
OBJETIVO: Verificar la capacidad de un nuevo test para identificar individuos portadores o no de discromatopsia y graduar su alteración, teniendo como base de comparación el test estándar de Ishihara.
MÉTODOS: Quince imágenes creadas para el diagnóstico de discromatopsia se utilizaron en el desarrollo de la nueva prueba. A partir de éstas, las cuales son eficaces en el diagnóstico de discromatopsia, se han creado 120 imágenes numéricas con graduaciones crecientes de -10% a +40% del color verde en cada uno de los números. Dichas imágenes fueron distribuidas en 15 páginas, impresas y presentadas a los individuos participantes del test, quienes deberían identificar el número que visualizaban en cada una de las imágenes.
RESULTADOS: se evaluaron 223 individuos, siendo 130 del sexo femenino y 93 del sexo masculino. Cinco individuos del sexo masculino fueron diagnosticados con discromatopsia, con 62,6% de errores de identificación de las 135 imágenes presentadas, mientras los demás presentaron, en promedio, un 5,04% de errores. La variación en la graduación del color verde en los números de las imágenes presentadas no permitió medir el grado de discromatopsia.
CONCLUSIÓN: El porcentaje de individuos diagnosticados con discromatopsia fue menor que el esperado. No fue posible graduar la discromatopsia con el test que se ha creado, sin embargo, con el desarrollo del software, será posible crear nuevos tests para diagnosticar y graduar la discromatopsia.
Palabras-clave: Achromatopsia; Defectos de la Visión Cromática; Daltonismo; Pruebas de Percepción de Colores.
INTRODUCTION
The English scientist John Dalton pioneered the study of congenital color vision abnormalities in 1798.1,2 Hence, congenital color vision deficiency is commonly known as Daltonism. However, some authors describe congenital color vision deficiency as synonymous with congenital dyschromatopsia,3 whereas others believe it is synonymous with protanopia.4
Dyschromatopsia (dys = disorder; chromos = color; opsis = eye) is a term used to denote any anomaly in color vision. People with congenital dyschromatopsia are rarely aware of their disorder, because their visual system is based on the distinctions or comparisons between color fields formed from differences in brightness and color saturation.5 Disorders involving seeing green and red are the most prevalent worldwide.6, 7, 8 In Brazil, the incidence of dyschromatopsia is approximately 8% for men and 0.4% for women.9
Several tests to evaluate chromatic sensitivity have been developed over the years, including the Ishihara test, the Hardy–Rand–Rittler plates, the City University Colour Vision Test, the Farnsworth-Munsell 100-Hue test, and the Farnsworth D15 Color Blindness Test. Another option, the Cambridge Colour Test (CCT), has been applied in computer-based scientific studies.10, 11, 12.
Despite the variety of existing tests, none are considered complete. They are limited by hue degradation and changes over time in the variability of tones according to the lighting and by the difficulty in instructing patients on how to use them.12
Therefore, this study sought to determine the efficacy of a new test in terms of its ability to identify individuals with and without dyschromatopsia, having as basis of comparison the standard test Ishihara and to determine the degree of their disorder.
METHODS
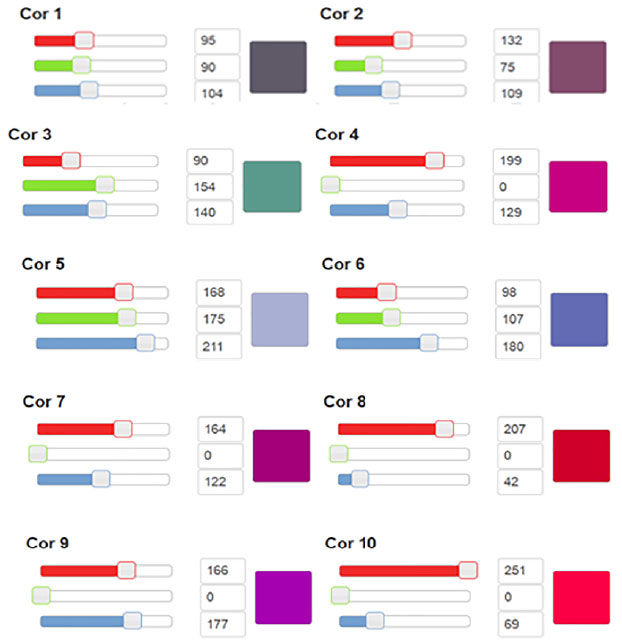
Graphics-editing software developed by the researchers foreseen for research and patented at INPI (Instituto Nacional de Propriedade Industrial) was used to create images containing 900 circles with editable numbers in the center. (Figure 1) Seven colors with different intensities make up the background and 3 different colors form the center number. Colors are defined as precise blends of the 3 primary colors (Red, Green, and Blue). Each primary color has 256 values. This makes 16,777,216 possible colors. In a previous study, we had selected 15 images that were equivalent to those used in the Ishihara test for the diagnosis of dyschromatopsia.
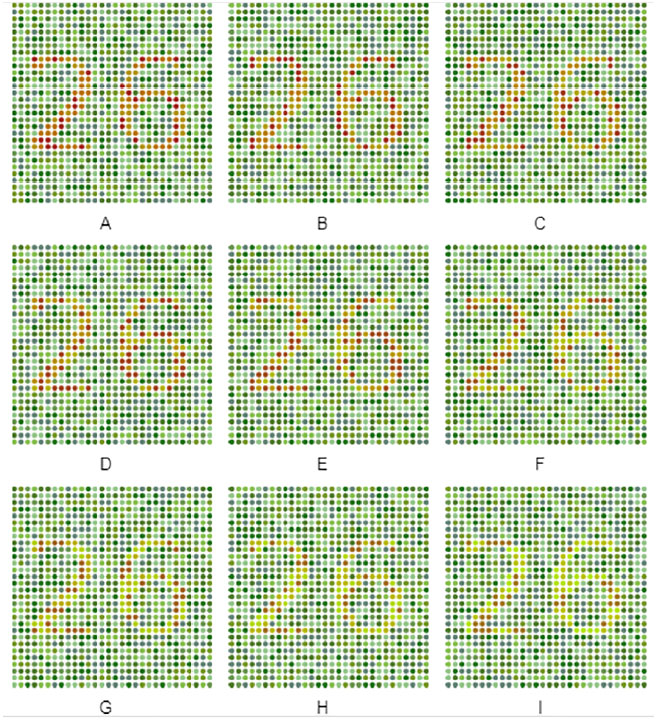
From these images and using precisely defined colors, were created 120 more images of numbers with different intensity gradients of −10%, −20%, −30%, −40%, +10%, +20%, +30%, and +40% of green hue. These images were distributed into 15 tables, each of which contained 9 images identified as A to I, which were printed and presented to the participants, as shown in Figure 2. Individuals were asked to identify the number present in the image and to mark an “X” on a scoresheet labeled with the letters A to I next to the letter corresponding to the image in which they were able to see the number. If they did not see the number, they were instructed to leave the position corresponding to that image blank on the scoresheet.
The test was applied in two steps. Initially, the individual had to write down the numbers he saw on the 15 plates contained in Ishihara’s Test (Ishihara’s Test for Color Deficiency 24 plates - edition 1997 - Kanehara & Co., LTD, Tokyo, Japan). Later he had to write down the numbers he could see from the 15 printed images that make up the new test. The individual participant would have to identify the number contained in the image.
The data collected were organized into a spreadsheet containing correct answers and errors, comparing the Ishihara test and then analyzed statistically. Shapiro–Wilk tests were performed to verify the assumption of normal distribution of the continuous variables.
Thus, the studied variable consists of the correct identification of the printed figure, being measured by the frequency of correct answers in the new test when comparing with the figure of the standard diagnostic test for dyschromatopsia (Ishihara).
These variables were compared for gender as a factor using the non-parametric Mann–Whitney U-test. Pearson’s chi-squared test was used to determine whether there was an association between gender and a 100% score on the test. To measure the strength of association, the odds ratio and 95% confidence interval were calculated. All statistical analyses were performed at a significance level of 0.05 using SPSS software, version 18.
In order to define the sample size, the prevalence of congenital dyschromatopsia in the population was calculated using Formula 1 below:16
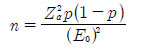
Where: Zα = 1.96 (for estimates using 95% confidence intervals), p is the expected proportion of subjects in the study and E0 is a measure of the sample error or precision error that was accepted for the study.
Given the fact that the expected prevalence of dyschromatopsia is less than 10% and given a margin of error of 5% on this estimate (E0 = 0.05 or E0 = 5%) and a 95% confidence interval, the minimum sample size (n) was determined to be 138 individuals.
This new test was developed as part of a partnership between the Departments of Medicine and Computer Science at the Centro Universitario de Belo Horizonte. The project was approved by the Research Ethics Committee on September 3, 2014 with the Certificate of Presentation for Ethical Consideration registry number 35526014.0.0000.5093. All the individuals tested were informed about the test and signed the informed consent form.
With the new test images defined, a cross-sectional study was carried out using the Ishihara test and the new test developed with images presented to participants in printed form. The individuals tested were randomly selected from students who attended the last 3 grades of regular education, aged between 15 and 18 years.
All the tests were performed indoors with the presence of windows that allowed the entrance of daylight. No test was performed under artificial light or at times of low natural light. In addition to the controlled luminosity, the participants of the tests were placed at a distance of reading of the presented images, that is to say, about 45cm of distance. There were no corrections in visual acuity and refractive errors of the participants, except for those who previously used corrective lenses. Response time was not defined and communication between participants was prevented during the application of the test.
The images selected for the test represent images aimed at the diagnosis of deficiency in the deutan and protan color axes. To simulate these deficiencies and thus obtain a more consistent parameter in the creation of the images, the researchers used glasses with subtractive filters for the green and red colors, in order to simulate the vision of a dyscromatopsia carrier of the protan and deutan, which are the most prevalent in the population.13
The slides occupied a sheet of 21cm x 29.5cm, had standard character size and color saturation level as defined by the software.
As limitations of the study, it was not part of this investigation to consider variations of size, color saturation or other technical data because the initial blade model was previously defined according to the Ishihara test and the settings pointed out by the software. In addition, all characters are numeric, which can make your application unlearnable for illiterates.
The comparative analysis between the images of the original Ishihara test and the new test demonstrated, in a previous study for validation of the test, in both cases, high agreement (96%) between the results of the tests. Despite the high agreement between the results, the cut-off point for defining the presence of color vision deficiency was 13 hits in 15, higher than in the original Ishihara test, in order to obtain a sensitivity of 100% and specificity of 100 %.
RESULTS
A total of 223 volunteers from 2 public high schools in Belo Horizonte, Brazil, aged ≥16 years were evaluated. Of the total number of participants, 130 (58.3%) were females and 93 (41.7%) were males. The mean age of the subjects was 16.8 years, with a standard deviation of 0.8 years. The median age was 17 years.
Graph 1 shows that most of the subjects presented high scores for both the sum (maximum = 135) and percentage of correct answers in the identification of the green hue in the images with their respective intensity gradients.
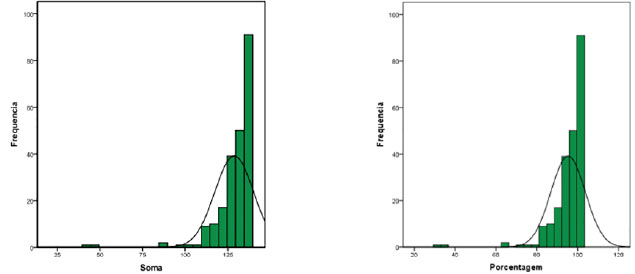
The median value of the sum was 132, indicating that 50% of individuals had a sum ≥132 values. The first and third quartiles were equal to 127 and 135, respectively. These values indicated that 25% and 75% of the individuals presented sums less than or equal to 127 and 135 values, respectively. When the percentage of correct answers was considered, the median value was found to be 97.78, indicating that 50% of the subjects achieved a percentage ≥97.78%. The first and third quartiles were equal to 94.07 and 100, respectively. These values indicated that 25% and 75% of the individuals presented sums less than or equal to 94.07% and 100%, respectively.
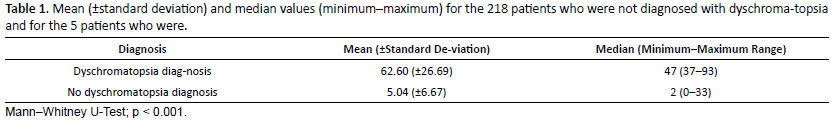
Five individuals presented a high degree of error (62.5%). These subjects either failed to identify or incorrectly identified the number in the image. The remaining 128 subjects correctly identified the vast majority of the numbers in the images, with a mean error rate of 5.04%. Therefore, the 5 individuals who made more mistakes were diagnosed as having some degree of dyschromatopsia. Based on the Mann–Whitney U-test, the difference between the 2 groups was found to be statistically significant (p < 0.001), as shown in Table 1.
The 5 subjects diagnosed with dyschromatopsia presented a high rate of error in the identification of the numbers in the 135 test images (15 numbers with 9 different intensities of color). However, no uniform variations in responses were found to be associated with the variations in the intensities of green contained in the numbers in the images. This indicated that numbers with lower intensities of green were not more difficult to identify than those with the highest intensity of green.
DISCUSSION
The need for correct perception of colors in academic, artistic, professional, industrial, and even scientific activities has made the study of the characterization of color vision disorders increasingly important. Color vision tests that identify disorders and patients’ degree of impairment have therefore become increasingly necessary. Current tests seek to classify individuals as normal or abnormal according to their color perception and to determine different degrees of dyschromatopsia (mild, moderate, and high).14
This study sought to determine the efficacy of a new test no only to identify individuals with and without dyschromatopsia, but also quantify abnormal grade the disorder.
Among the tests for the clinical evaluation of chromatic sensitivity, the Ishihara test is the best known and the most commonly used test worldwide. Studies show that it is still the most effective exam (the gold standard) for a quick identification of congenital color vision deficiencies. However, this test cannot provide a quantitative evaluation of the deficiency presented because it does not include boards for measuring the disorder severity.14 It is a printed material, which fade and may interfere with the diagnosis. The standardization of the test and proof of its sensitivity will lead to the production of material available on the electronic platforms, such as smartphone and tablet applications, which would solve this issue. In addition, it would not be necessary to perform color vision tests complementary to the Ishihara when the characterization of the type and intensity of dyschromatopsia becomes necessary.15
Computerization of color vision tests can be seen as a way to overcome some of the difficulties inherent to former methods by minimizing errors in light and color variation and mistakes made by examiners in the calculation and presentation of results. This tool makes the tests more reproducible, facilitates their clinical use, reduces the resources needed, and reduces the time required to analyze the results.14 After standardization, the test will be available through an app for tablets and smartphones.
The use of electronic platforms to perform chromatic sensitivity tests is already known and there are some tests available, but they have limitations. The TwoDocs Test (version 95, TwoDocs, Inc.) is a computer-based test for evaluating color vision and contrast sensitivity as well as their abnormalities. The sensitivity and specificity of this test have been evaluated and were considered to be overestimated. Therefore, the test is considered useful for screening; however, another test is required to confirm the diagnosis.6
The same findings were reported for the computer-based color vision test known as the City University Colour Vision Test. Despite the high quality of the calibrated monitor and graphics card used in the computer, the computerization was unable to accurately reproduce the colors of the gold standard and overestimated the diagnosis.17
In the case of the Mollon–Reffin minimal color vision test and its commercial version, the CCT, studies have demonstrated that if the necessary adaptations are made, the test is suitable for assessing color discrimination in young children and can be a useful tool for identifying color vision variations during development.18, 19
In the face of all this, the need to standardize a more complete test not only to identify individuals with dyschromatopsia but also to quantify and grade their disorder, combined with the ease of available technologies and applications, is further reinforced.
The use of computer and mobile device applications as diagnostic tools in ophthalmology has become commonplace. For example, Snellen eye charts for smartphones can now be used to test visual acuity. Some applications allow professionals to test characteristics such as color vision, pupil size, and oculomotor reflexes, whereas others offer tests for astigmatism and an Amsler grid, just to name a few.20 Even so, the use of smartphones, particularly as diagnostic tools, has not been standardized, and the results must be carefully considered.21
Five of the subjects in this study were diagnosed with dyschromatopsia using the test created herein. This result is consistent with data in the literature: red–green dyschromatopsia is caused by changes in the X chromosome, and its transmission is recessive X-linked, indicating that the prevalence of dyschromatopsia is higher in males.15
In terms of percentages, these individuals accounted for 5.37% of the study sample, a percentage that was lower than expected because the available prevalence data point to dyschromatopsia in 8% of men and 0.4% of women.7 This difference is likely due to the fact that extreme differences in the intensity of green of the numbers on the test were on the same page, which may have made it easier for subjects to correctly identify the numbers. Therefore, the variation in the intensity of green in the numbers presented in the images did not allow for the measurement of the degree of dyschromatopsia. It is important to note that the quantification of dyschromatopsia does not imply the severity of the disorder.
The study demonstrated that the new test is able to diagnose dyschromatopsia in the general population. The proposal is, after standardization, the production of a material available on the electronic platforms, such as smartphone and tablet applications, for the test to be used in the ophthalmological consultation.
CONCLUSION
Evaluation of the chromatic sensitivity is of fundamental importance in ophthalmology practice. Although the test proposed herein was able to identify subjects with dyschromatopsia in the study sample, it still requires additional evaluation and adjustments before its true ability to evaluate color vision and measure the degree of dyschromatopsia can be determined. The latter was not possible in this study, in which only the intensity of green of the number varied on the test.
We believe that the software used in this study will allow us to create new tests in order to diagnose and measure color vision disorders more easily and accurately.
REFERENCES
1. Greenaway F. John Dalton and the atom. New York: Cornell University Press; 1966. p. 28-45.
2. Dalton J. Extraordinary facts relating to the vision of colours: with observations. Mem Lit Philos Soc Manchester. 1798;5(1):28-45.
3. Alves AA. Refração. 2a ed. Rio de Janeiro: Cultura Médica; 1994. p. 258-69.
4. Urbano LCV. Discromatopsia: métodos de exame. Arq Bras Oftalmol. 1978;41(5):236-52.
5. Pokorny J, Smith V. Color vision and night vision. In: Ryan SJ, ed. Retina. 2nd ed. St. Louis: Mosby; 1994. p. 127-45.
6. Scanlon JV, Roberts J. Color vision deficiencies in children, United States. Rockville: National Center for Health Statistics; 1972 [acesso 2018 Maio 17]. Disponível em: https://www.cdc.gov/nchs/data/series/sr_11/sr11_118.pdf
7. Birch J. Worldwide prevalence of red-green color deficiency. J Opt Soc Am A Opt Image Sci Vis. 2012;29(3):313-20. DOI: https://doi.org/10.1364/JOSAA.29.000313
8. Xie JZ, Tarczy-Hornoch K, Lin J, Cotter SA, Torres M, Varma R; Multi-Ethnic Pediatric Eye Disease Study Group. Color vision deficiency in preschool children: the multi-ethnic pediatric eye disease study. Ophthalmology. 2014;121(7):1469-74. DOI: 10.1016/j.ophtha.2014.01.018
9. Abreu FJQ, Abreu Filho JMQ, Abreu JMQ. Acromatopsia com ambliopia: a propósito de 3 casos. Rev Bras Oftalmol. 1987; 46(1):1-8.
10. Feitosa-Santana C, Paramei GV, Nishi M, Gualtieri M, Costa MF, Ventura DF. Color vision impairment in type 2 diabetes assessed by the D-15d test and the Cambridge Colour Test. Ophthalmic Physiol Opt. 2010;30(5):717-23. DOI: 10.1111/j.1475-1313.2010.00776.x
11. Moura AL, Teixeira RA, Oiwa NN, Costa MF, Feitosa-Santana C, Callegaro D, et al. Chro-matic discrimination losses in multiple sclerosis patients with and without optic neuritis using the Cambridge Colour Test. Vis Neurosci. 2008;25(3):463-8. DOI: 10.1017/S0952523808080437
12. Costa MF, Oliveira AG, Feitosa-Santana C, Zatz M, Ventura DF. Red-green color vision impairment in Duchenne muscular dystrophy. Am J Human Genet. 2007;80(6):1064-75. DOI: http://dx.doi.org/10.1086/518127
13. Kjaer PK, Salomão SR, Belfort R Jr, Colella ALD. Validação clínica de teste psicofísico computadorizado para avaliação de visão de cores e sensibilidade ao contraste. Arq Bras Oftalmol. 2000;63(3):185-9. DOI: http://dx.doi.org/10.1590/S0004-27492000000300004
14. Cole BL. Assessment of inherited colour vision defects in clinical practice. Clin Exp Optom. 2007;90(3):157-75. DOI: 10.1111/j.1444-0938.2007.00135.x
15. Fernandes LC, Urbano LCV. Eficiência dos testes cromáticos de comparação na discromatopsia hereditária: relato de casos. Arq Bras Oftalmol. 2008;71(4):585-8. DOI: http://dx.doi.org/10.1590/S0004-27492008000400023
16. Gegenfurtner KR, Wichmann FA, Sharpe LT. The contribution of color to visual memory in X-chromosome-linked dichromats. Vision Res. 1998;38(7):1041-5. DOI : https://doi.org/10.1016/S0042-6989(97)00200-9
17. Ing EB, Parker JA, Emerton LA. Computadorized colour vision testing. Can J Ophthalmol. 1994;29(3):125-8.
18. Goulart PR, Bandeira ML, Tsubota D, Oiwa NN, Costa MF, Ventura DF. A computer-controlled color vision test for children based on the Cambridge Colour Test. Vis Neurosci. 2008;25(3):445-50. DOI: 10.1017/S0952523808080589
19. Lima MG, Gomes BD, Ventura DF, Silveira LCL. Métodos utilizados na avaliação psicofísica da visão de cores humana. Psicol USP. 2011;22(1):197-222. DOI: http://dx.doi.org/10.1590/S0103-65642011005000002
20. Lord RK, Shah VA, San Filippo AN, Krishna R. Novel uses of smart phones in ophthalmolo-gy. Ophthalmology. 2010;117(6):1274-1274.e3. DOI: http://dx.doi.org/10.1016/j.ophtha.2010.01.001
21. Zvornicanin E, Zvornicanin J, Hadziefendic B. The Use of Smart Phones in Ophthalmology. Acta Inform Med. 2014;22(3):206-9. DOI: http://doi.org/10.5455/aim.2014.22.206-209


Funding: No specific financial support was available for this study
CEP Approval: not applicable
Disclosure of potential conflicts of interest: None of the authors have any potential conflict of interest to disclose
Received on:
March 25, 2018.
Accepted on:
April 16, 2018.
 eOftalmo está licenciada com uma Licença Creative Commons Atribuição-NãoComercial 4.0 Internacional.
![]() © 2026 Todos os Direitos Reservados
© 2026 Todos os Direitos Reservados


 Ler em português
 Português PDF
 Imprimir
 Enviar este artigo por email
 Como citar este artigo
 Enviar um comentário
 Mendeley
 Pocket